FREEPNG.FR
Recherche
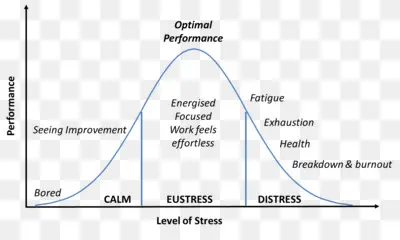
Courbe De Performance En Contrainte,Stresser PNG Téléchargement gratuit
Courbe De Performance En Contrainte
Stresser
Performance
Performances Optimales
Eustress
Détresse
Calme
49.73 KB
Vous pourriez aussi aimer
Courbe En Cloche
Statistiques
Carte De Contrôle
Graphique
Pyramide Des âges
Données Démographiques
Modèle En Spirale
Spirale
Courbe En Cloche
Statistiques
Étapes De Développement De L'équipe
Formation
Distribution Normale
Statistiques
Graphique
Courbe
Carte Du Parcours Client
Client
Diagramme De Processus De Changement
Mesures
Gestion Des Données
Graphique
Graphique Du Potentiel D'action
Neurosciences
Courbe D'adoption
Innovation
Cycle Cellulaire
Mitose
Courbe De Contrainte
Performance
Graphique Comportemental
Motivation
Distribution Normale
Statistiques
Graphique De Motivation
Progrès
Courbe De Croissance Bactérienne
Bactéries
Graphique Du Potentiel D'action
Neurone
Graphique
Contrainte De Cisaillement
Graphique Du Cycle économique
Graphique
Réaction Enzymatique
énergie D'activation
Diagramme D'énergie Potentielle
énergie
Graphique Des Connaissances
Connaissance
Chronologie Du Projet
Étapes
Parcours Client
Commercialisation
Diagramme Des Délais De Livraison
Délai De Mise En œuvre
Courbe De Motivation
émotions
Diagramme Du Taux D'adoption
Graphique
Carte Du Voyage
Carte
Messagerie Client
Efficace
Barrières De Sécurité
Prévention
Diagramme De La Chaîne D'approvisionnement
Entreprise
Distribution Normale
Statistiques
Tableau De Conformité
Entreprise
Graphique De La Valeur P
Probabilité
Graphique De Motivation
Progrès
Courbe De Compétences
Compétence
Graphique De Motivation
Capacité
Étapes De Développement De L'équipe
Travail D'équipe
Cycle De Vie Du Produit
Ventes
Courbe De Leadership
Direction
Graphique Du Cycle Cellulaire
étapes
Courbe En Cloche
Statistiques
Graphique Du Cycle De Vie Du Produit
Cycle De Vie
Montagnes Russes
équipe
Cycle De Vie Du Produit
Développement
Gestion De Projet
Planification
Processus De Planification Stratégique
Objectifs
Graphique
Données
Diagramme énergétique
Réactifs
Cycle Devops
Développement
Graphique D'énergie D'ionisation
Graphique
Graphique D'onde
Excitation
Modèle De Croyance En Matière De Santé
Santé
Diagramme De Précipitation Des Protéines
Science
Graphique
Population
Processus D'innovation
Pensée Conceptuelle
Système De Gestion De La Qualité
Plan
Courbe De Performances
Croissance
Réaction Exergonique
Graphique
Analyse Des Données
Graphique
Courbe En Cloche
Distribution Normale
Diagramme D'analyse Commerciale
Planification
Courbe En Cloche
Statistiques
Distribution Normale
Statistiques
Pyramide
équipe
Distribution Des Ondes Statistiques
Graphique
Graphique De Part De Marché
Innovation
Graphiques De Réaction
Exothermique
Graphique Du Cycle Cellulaire
étapes
Graphique De Distribution Normale
Statistiques
Graphique De Glycémie
Glucose
Organigramme
Soupape
Diagramme énergétique
Catalyseur
Graphique
Performance
Graphique De Création De Valeur
Entreprise
Tableau De Confiance En Matière De Codage
Codage
Graphique
Fonction
Diagramme Pyramidal
Valeurs
Graphique De Charge électrique
Production Solaire
Courbe En Cloche
Statistiques
Modèle En Spirale
Spirale
Pyramide Organisationnelle
Hiérarchie
Réaction Exergonique
Graphique
Graphique Du Ph
Activité
Graphique Du Taux D'échec
Statistiques
Courbe En Cloche
Statistiques
Messagerie Client
Efficace
Pyramide De Gestion
Hiérarchie
Chronologie Du Projet
Avantage Acheteur
Graphique De Satisfaction Client
Loyauté
Cycle De Vie Pharmaceutique
Graphique
Graphique De Probabilité
Statistiques
Industrie 4 0
Technologie
Graphique D'inégalité De Bell
Physique
Graphique
Doubler
Courbe En Cloche
Statistiques
Graphique Des Taux De Natalité Et De Mortalité
Population
Graphique
Pression
Diagramme De La Culture De Sécurité
Sécurité
Tableau De Valeur Commerciale
Société
Graphique D'activité Enzymatique
Biologie
Graphique De Concentration
Keimbildung
Courbe En Cloche
Statistiques
Processus De Recherche
Données
Processus De Réflexion Conceptuelle
Processus
Graphique De La Courbe D'indifférence
Pommes
Trépartition
Statistiques
Diagramme énergétique
Chimie
Graphique
Forcer
Graphique De Sélection Directionnelle
Coléoptères
Flèche De Sensibilisation
Progrès
Pyramide De L'information
Bleu
Diagramme De Cause à Effet
Arête De Poisson
Hydrogramme
Précipitations
Organigramme
Processus
Diagramme énergétique
Réaction
Graphique
Avantages
Messagerie Client
Efficace
Graphique
Fonction
Graphique
Fonction
Modèle En Spirale
Spirale
Pyramide D'approvisionnement
Stratégie
Diagramme De Flux De Travail
Processus
Styles De Gestion
Orientation Vers Les Tâches
Graphique De Sélection Directionnelle
Coléoptères
Graphique
Données
Graphique De Développement
Fonction Cognitive
Diagramme De Processus Métier
Flux De Travail
Tableau Du Plan De Formation
Volume
Graphique
Doubler
Distribution Normale
Statistiques
Parcours Client
Conscience
Diagramme D'analyse Des écarts
Entreprise
Graphique
Données
Organigramme
Processus
Analyse Swot
Entreprise
Diagramme énergétique
Chimie
Spectre D'ondes
Flots
Graphique Des Catastrophes Malthusiennes
Population
Répartition Du Qi
Graphique
Graphique Des Performances
Graphique
Diagramme énergétique
Réactifs
Graphique
Vih
Hiérarchie Des Contrôles
Sécurité
Graphique
Vitesse
Graphique
Doubler
Distribution Des Ondes Statistiques
Graphique
Organigramme
Processus
Organigramme
Mesures
Diagramme énergétique
Catalyseur
Modèle En Spirale
Spirale
Diagramme énergétique
Chimie
Diagramme De Dynamique D'équipe
Équipe
Pyramide Des âges
Données Démographiques
Graphique D'impulsion
Intensité
Pyramide D'apprentissage
Pyramide
Graphique
Données
Distribution Normale
Statistiques
Graphique
Données
Réaction Exergonique
Graphique
Diagramme De Cause à Effet
Arête De Poisson
Courbe De Laffer
Taux D'imposition
Distribution Normale
Statistiques
Graphique
Exponentiel
Graphique
Fonction
Courbe D'attente
Temps
Graphique
Fonction
Tableau De Classification Climatique
Climat
Distribution Normale
Statistiques
Tableau De Performance De Gestion
Gestion
Organigramme
Processus
Processus De La Chaîne D'approvisionnement
Processus
Graphique Du Taux D'échec
Taux D'échec
Courbe De Croissance Des Bactéries
Bactéries
Changement De Comportement
Graphique
Graphique De Fluorescence
Protéine
Courbe En Cloche
Écart Type
Diagramme De Diffraction
Intensité
Diagramme Hiérarchique
Structure
Graphique
Fonction
La Hiérarchie Des Besoins De Maslow
Maslow
Courbe En Cloche
Statistiques
Analyse Des Données
Graphique
Spectre D'ondes
Flots
Tableau De Progestérone
Hormone
Gestion Des Catégories
Processus
Organigramme
Processus
Graphique Force Extension
Chargement
Organigramme
Mesures
Courbes De Gauss
Statistiques
Intelligence D'affaires
Analytique
Processus De Sécurité
Classer
Hiérarchie Des Besoins Sociétaux
Hiérarchie
Niveau De Pression Acoustique
Fréquence
Diagramme énergétique
Réactifs
Graphique Des Taux De Natalité Et De Mortalité
Population
Mots clés tendances
Horloge
Shampoo
Blue Dessin Animée
Onomatopoeia
Fruit Du Dragon
Voiture
Valise Chapeau
Noeud Coeur
Grenoble
Hiver
Escalier Beton
Leaks
Visage De Petite Fille
Veste
1 Way
Caisse Transport
Jeune Montre
Panneau Solaire
Brodie Helmet
Animaux Mechant
Femme Blonde
Greyhawk
Chronomètre
Chat Qui Dort
Localisation Or
Télécharger
Es-tu un robot ?